📌 Key Takeaways:
Factory tours separate serious suppliers from showroom performers when you know what evidence to demand.
Score Five Core Areas Systematically: Rate People, Process, Equipment, Quality, and Compliance using a 100-point system with Pass/Concern/Risk categories to create defensible supplier comparisons.
Document Evidence, Not Promises: Record specific artifacts like calibration dates, work instruction revisions, and SPC chart timestamps rather than accepting verbal assurances about capabilities.
Demand Live Traceability Demonstrations: Require suppliers to trace a unit serial number through test data and component lot IDs via their MES system to verify containment and root-cause capabilities.
Structure Tours for Maximum Intelligence: Follow a disciplined 90-120 minute agenda covering line walks, test coverage demos, and documentation reviews to avoid staged presentations.
Convert Observations Into Risk Categories: Map identified gaps to program risks affecting yield, quality risks impacting warranty exposure, and compliance risks delaying market entry.
Systematic evaluation transforms supplier selection from guesswork into objective risk assessment.
For purchasing and compliance leaders at audio companies evaluating amplifier manufacturing partners, these structured approaches ensure technical due diligence supports strategic supplier decisions.
The most reliable launches don’t happen by luck. They come from factories where discipline shows up on the line, in the logs, and at the gates.
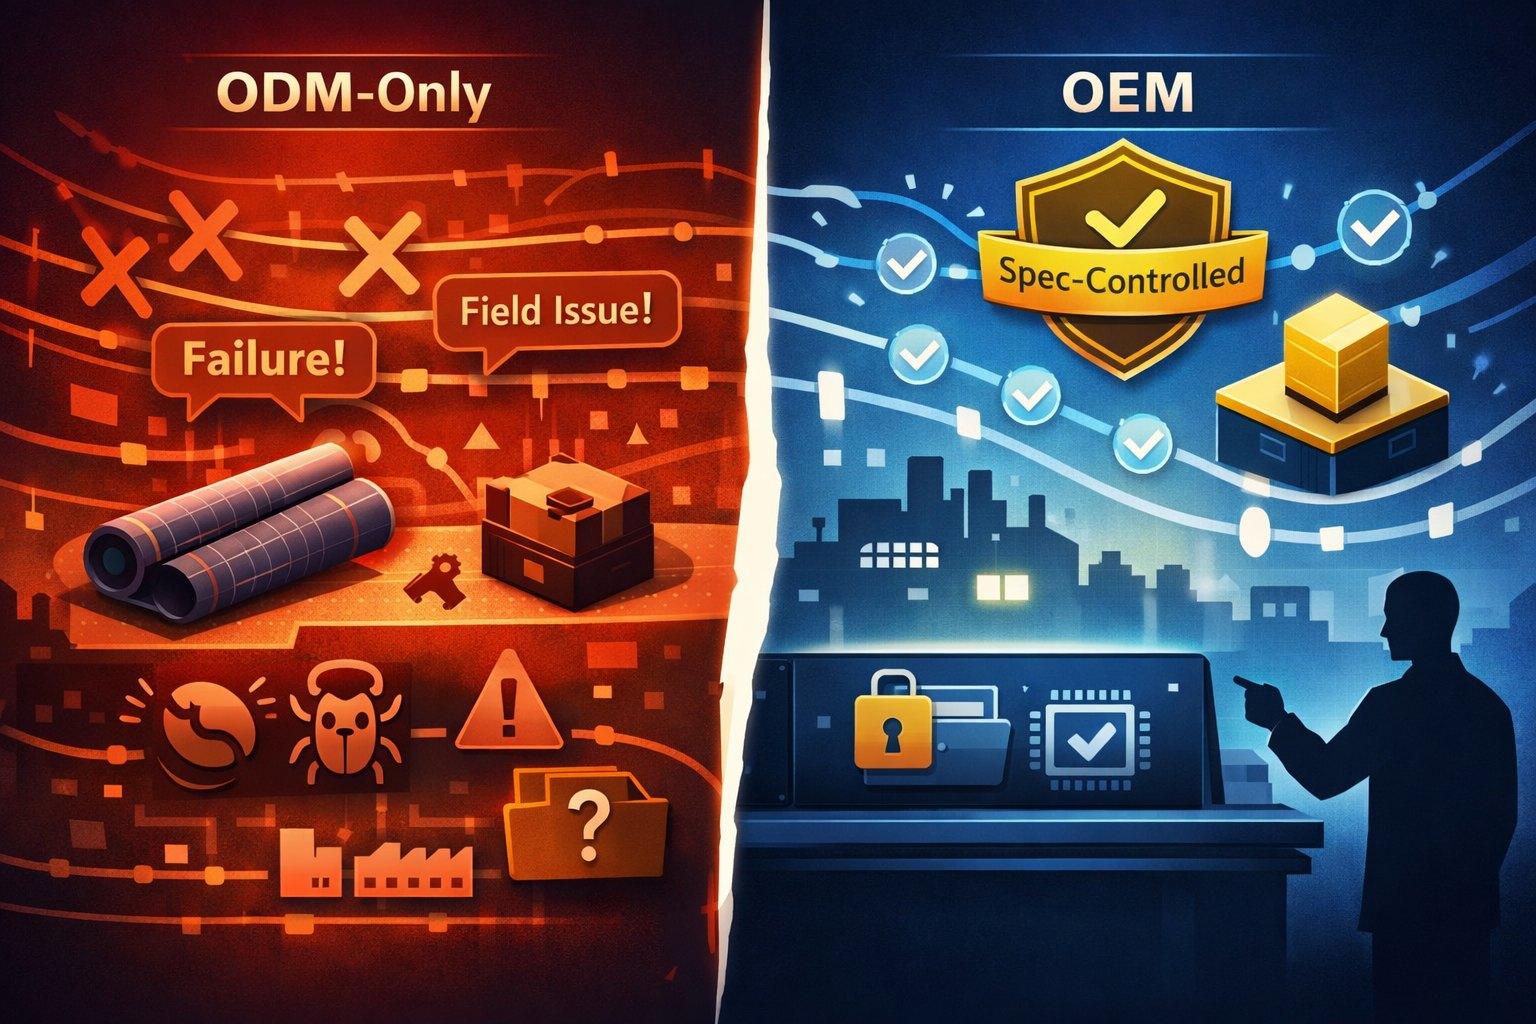
A factory evaluation, in amplifier programs, is a structured review of people, process, equipment, quality, and compliance to judge whether a site can take a design through DFM, NPI, pilot, and ramp with predictable outcomes. Think of the plant as a production engine: tuned components like skills, fixtures, and software working in sequence to deliver stable power day after day. Picture the tour this week—machines humming at steady takt, calibration stickers current, pilot boards stacked beside ATE terminals. The goal isn’t promises; it’s proof.
On a tour, score People, Process, Equipment, Quality, and Compliance. Confirm a clear DFM→NPI→Ramp flow with pilot and first-article gates, ATE and EOL coverage traced to unit serials via MES, and current compliance and labeling artifacts. Request the documents that prove each claim. That’s how factory evaluation de-risks selection and keeps amplifier launches on time.
“A factory’s promises don’t ship on time—its processes do.”
What This Checklist Does (And How to Use It)
Start with a 100-point score (20 points per group). For each item below, mark Pass, Concern, or Risk and note the evidence you saw—document name, log date, or sample ID. Pass ratings earn full points, Concern ratings earn partial credit, and Risk ratings signal potential program delays.
After the walk-through, request copies of the pilot plan, first-article acceptance matrix, recent CAPAs, calibration and PM logs, labeling proofs, and a standards applicability list with current report dates. This creates a defensible short-list and clean handoff to your engineering and QA partners.
Evidence Documentation Strategy Document what you observed, not what was promised. Note specific artifacts like work instruction revision dates, calibration stickers with current dates, or SPC charts with recent data points. This evidence column becomes critical during post-tour supplier comparison.
Pros: Evidence is visible, recent, and tied to serial numbers.
Cons: Anything “in progress” without dates, or process steps not linked to controlled documents.
People: Leadership, Engineering & Training
Strong amplifier manufacturing requires accountable ownership across disciplines. Look for organizational clarity that prevents issues from falling through functional gaps.
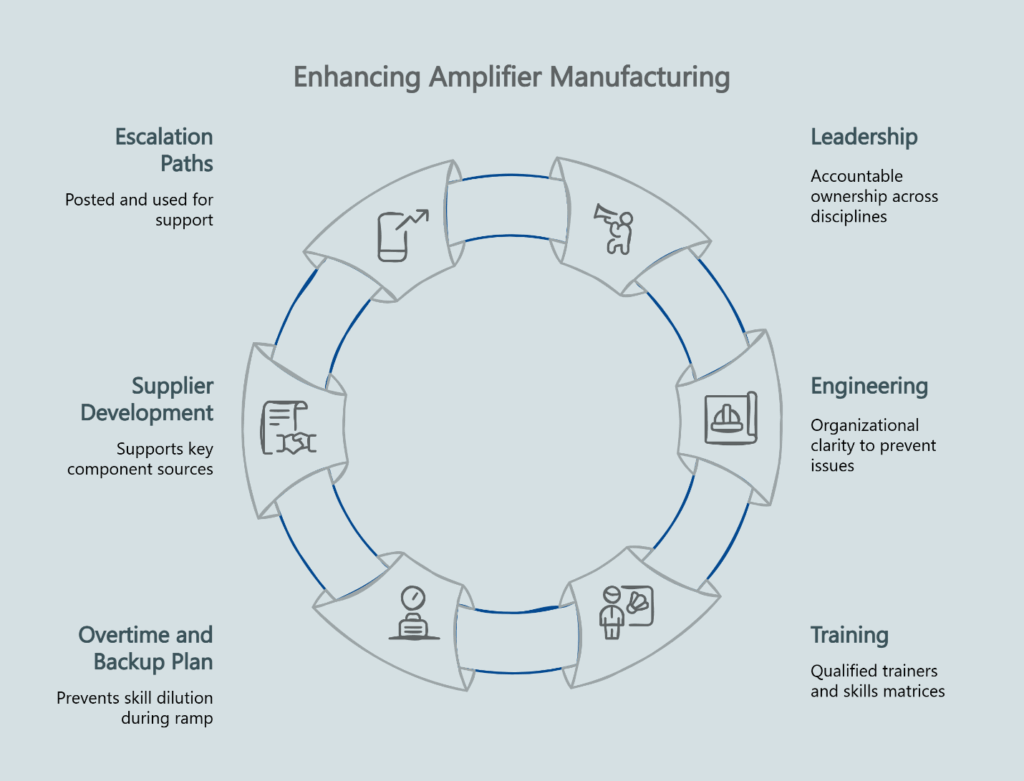
- Factory organizational chart shows accountable owners for DFM, NPI, QA, and compliance.
- Weekly cross-functional NPI meeting cadence is documented with action logs.
- Trainer qualifications and skills matrices exist for each station.
- Overtime and backup plan prevents skill dilution during ramp.
- Supplier development function supports key component sources.
- Escalation paths and on-call engineering support are posted and used.
Pros: Named owners answer confidently and point to logs.
Cons: Reliance on a few “heroes” or training records that trail actual assignments.
Process: DFM→NPI→Ramp Discipline
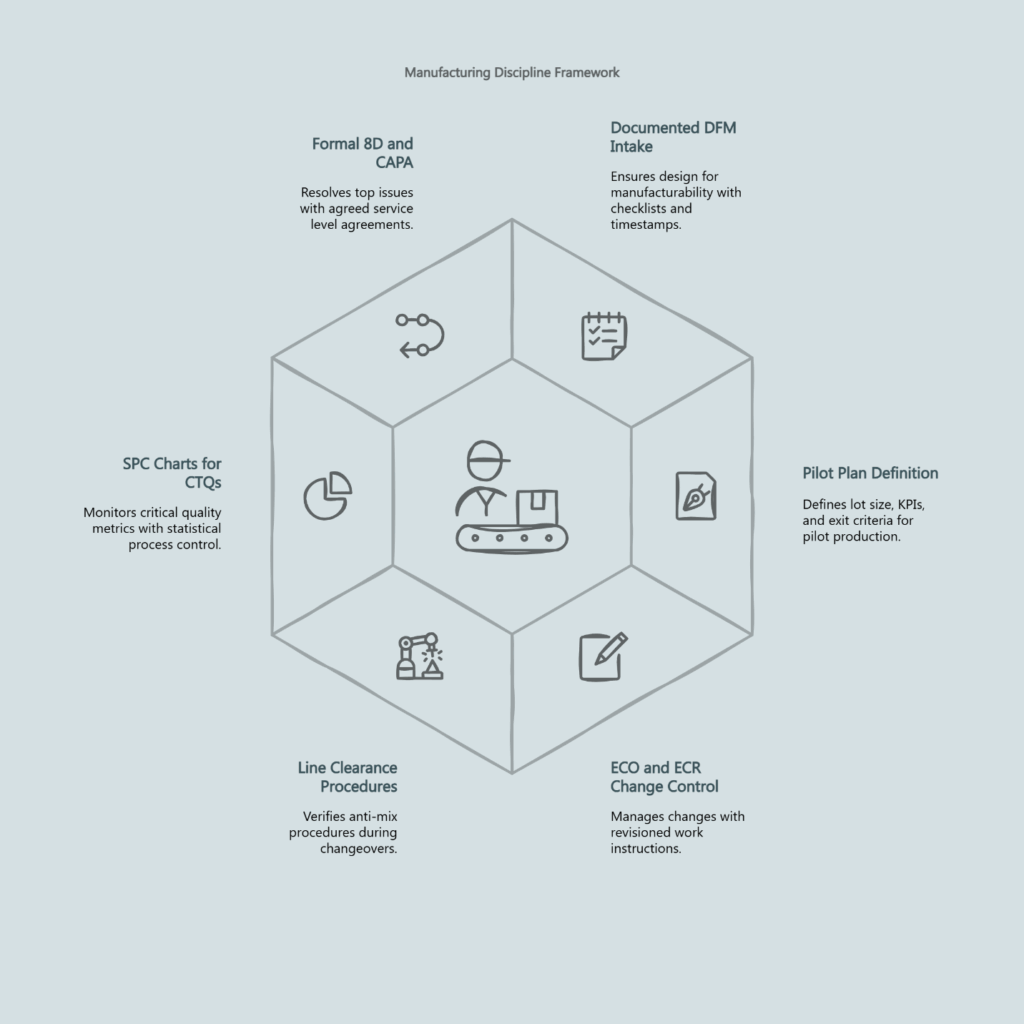
Manufacturing discipline shows up in documented handoffs between design, piloting, and full production phases. Each gate should have clear entry and exit criteria.
- Documented DFM intake with checklist and sign-off timestamps.
- Pilot plan defines lot size, KPIs, and exit criteria.
- ECO and ECR change control links to revisioned work instructions.
- Line clearance and anti-mix procedures verified at each changeover.
- SPC charts exist for CTQs such as solder, torque, and acoustic metrics.
- Formal 8D and CAPA closes top issues within agreed SLAs.
Pros: Gate criteria and KPI trends are visible, not verbal.
Cons: Paper trails that don’t match line behavior during changeovers.
Equipment: Capability, Maintenance & Coverage
Equipment capability determines your program’s feasibility while maintenance discipline affects long-term reliability. Focus on bottlenecks and coverage gaps.
- SMT and DIP lines sized for planned takt; bottlenecks identified.
- Fixture and ATE/EOL coverage map aligns to spec and CTQs.
- Preventive maintenance calendar with records and MTBF targets.
- Calibration logs current for gauges, analyzers, and fixtures.
- Critical spares list and response SLAs for downtime events.
- Environmental controls for temperature, humidity, and ESD monitored and logged.
Pros: PM and calibration stickers match system records; coverage maps tie to CTQs.
Cons: One-off fixtures with no spares, or expired calibrations.
Quality: First-Article & Reliability Proof
Quality systems should demonstrate capability before full production rather than discovering problems afterward. Look for proactive screening and feedback loops.
- First-article acceptance matrix with measurable ranges is in use.
- Incoming quality plans for critical components specify AQL and sampling.
- Reliability screens including burn-in, aging, and thermal or vibration testing where applicable.
- In-process defect mapping with Pareto and layered audits.
- DOA and NPF targets set and tracked by lot with containment plans.
- RMA feedback loop feeds ECOs and test updates.
Pros: First-article results tie to pilot lot IDs; DOA trend improving across lots.
Cons: Reliability steps done “when needed” or RMA learning not closing the loop.
Compliance: Safety & Labeling Readiness
Compliance preparation affects time-to-market and regulatory risk. Verify that standards interpretation and labeling processes are established before production.
- Standards applicability list maintained for safety and EMC.
- Labeling and marking artwork controls and durability methods defined.
- Technical file index with current test reports and declarations.
- Country-of-Origin and packaging markings verified on samples.
- RoHS and REACH material declarations stored and searchable.
- Supplier test and certification dates within acceptance windows.
Pros: Standards map aligns with product type; labeling proofs are signed and dated.
Cons: Out-of-date reports or unclear ownership of technical file updates.
First-Article Metrics (Proposed—Validate with Supplier)
As a starting point for negotiations, propose ATE pass rates ≥98% for pilot and first-article lots, with critical acoustic and electrical tolerances per product specification and sample sizes that exercise fixture variability. These figures represent common guardrails in electronics assembly; confirm exact numbers jointly and document them in the acceptance matrix.
Factory Tour Agenda (90–120 Minutes)
Structure your facility visit to maximize information gathering while respecting operational constraints.
- Kickoff: Review roles, program scope, and first-article goals.
- Line walk: Follow DFM intake through pilot line to ramp line transitions.
- Test coverage: Observe fixtures, ATE and EOL demo, plus data logging and MES trace.
- QA and documentation: Examine first-article matrix, CAPA samples, calibration and PM logs.
- Compliance and labeling: Review standards map, labeling proofs, and COO samples.
- Wrap-up: Complete evidence checklist to request post-tour.
Turning Tour Notes Into a Decision
Convert observations into a simple scorecard using the 20-point maximum per category system. Items marked Risk subtract 2-3 points each; Concern subtracts 1 point. Focus on gaps that represent program risk rather than minor process differences between suppliers.
Gaps map to follow-ups: missing SPC charts require request for current data, unclear coverage needs ATE and EOL mapping, weak traceability demands an MES serial-to-test-data demonstration. Share the score and evidence log with engineering, QA, and program management so the short-list remains defensible.
Schedule follow-up facility tours for finalists to verify initial observations and assess any improvement implementations. This second visit often reveals process maturity levels not apparent during initial presentations.
The most reliable suppliers demonstrate their capabilities through documented processes rather than impressive presentations. Your systematic evaluation creates the foundation for successful Amplifier Manufacturing Services partnerships that deliver consistent quality and timeline performance.
Why These Checks Matter
Quality systems make outcomes predictable. A documented quality management system aligned with ISO 9001 signals process control and continuous improvement. For safety, amplifier products typically fall under IEC/UL 62368-1 requirements for audio and ICT equipment. On the production line, workmanship expectations are commonly guided by IPC-A-610 standards for acceptability of electronic assemblies. Finally, guidance from NIST offers well-established principles around process control and measurement discipline—useful context as you assess SPC and calibration practices.
Frequently Asked Questions
How is ATE different from EOL testing?
ATE refers to automated functional tests typically executed in-line; EOL is the final comprehensive test before pack-out. Both should trace results to unit serials via MES so defects can be contained by lot and root-caused quickly.
What documents should be requested after the tour?
Ask for the pilot plan, first-article acceptance matrix, recent CAPAs, calibration and PM logs, labeling proofs, and a standards applicability list with current report dates. These are the minimum proofs needed to validate what was seen on the floor.
How many pilot units should be sampled?
Lot size should reflect design risk and complexity. The practical goal is to exercise fixtures, ECO flow, and ramp-rate assumptions—commonly multiple smaller lots rather than a single run—so learning can be captured between lots.
How do we verify MES and traceability?
Request a live trace from a unit serial to its test data and component lot IDs, and confirm records retention plus export capability. This is essential for fast containment and reliable warranty support.
Strong factory evaluation discipline de-risks supplier selection and keeps amplifier programs on schedule. When the production engine runs on visible gates, real data, and documented ownership, launches become reliable—and repeatable.
To continue the evaluation process with deeper understanding of capabilities and approach, explore our Amplifier Production processes, learn more about our Pro Audio expertise, or review our company background through About Us. For direct coordination of factory tours or program discussions, visit our Contact page.
Our Editorial Process
Our expert team uses AI tools to help organize and structure our initial drafts. Every piece is then extensively rewritten, fact-checked, and enriched with first-hand insights and experiences by expert humans on our Insights Team to ensure accuracy and clarity.