
📌 Key Takeaways
The supplier with the lowest price often wins by removing the quality controls that keep your product stable at scale.
- Unit Cost Hides True Cost: What you pay per unit ignores rework, warranty claims, and brand damage that show up later.
- Cheap Suppliers Cut Controls: A quote 10–15% below market usually means fewer inspections, cheaper parts swapped in, or rushed testing.
- Quality Drifts After Run One: The first batch gets extra attention; problems surface in Run 5, 10, or 20 when standards slip.
- Traceability Prevents Blame Games: Without records linking test data to each unit, you can’t trace defects or hold anyone accountable.
- Calculate the Real Break-Even: Model rework, warranty, and audit costs to show when the “cheaper” supplier actually costs more.
The lowest quote looks smart until the warranty claims arrive.
Product managers and QA leads evaluating OEM amplifier suppliers will find a clear framework for defending sourcing decisions, preparing them for the detailed cost-of-quality breakdown that follows.
~ ~ ~ ~ ~ ~ ~ ~ ~ ~ ~ ~ ~ ~ ~ ~ ~ ~ ~ ~ ~ ~ ~ ~ ~ ~ ~ ~ ~ ~ ~ ~ ~ ~ ~ ~ ~ ~ ~ ~ ~ ~ ~ ~ ~ ~ ~ ~ ~ ~ ~
The spreadsheet looks compelling. Supplier A’s quote sits 12% below everyone else. Finance wants a decision by Friday. The path of least resistance is obvious—until the first warranty claim arrives.
If you’re the PM or QA lead, that “clean win” also feels like a trap: the spreadsheet victory today can become your failure investigation six months from now, when a batch drifts, a component quietly changes, and you’re the one explaining warranty exposure and brand damage.
In OEM/ODM audio manufacturing, the greatest risk to a brand’s reputation isn’t unit cost. It’s Quality Drift: the gradual erosion of product consistency that begins after the first production run ships. The supplier who wins on price often achieves that number by removing the controls that prevent drift. You save on the line item. You pay on the warranty line, the rework line, and eventually, the brand-trust line.
Unit cost is a surface measurement. Program cost is what you actually pay to launch, scale, and keep a private-label amplifier stable: prevention controls, appraisal controls, and the cost of internal and external failures when those controls are missing.
This article reframes the procurement decision. Instead of comparing unit prices, you’ll learn to compare Total Cost of Quality—and walk away with a calculator framework to prove the math internally.
The Trap: Why “Lowest Unit Cost” Looks Rational on a Spreadsheet
Every private-label program faces the same pressure: hit the margin target. Procurement evaluates suppliers on BOM cost. Finance models the P&L on unit economics. The lowest bidder wins the column.
The problem is that “unit cost” measures only what you pay before production risk materializes. It ignores what you pay after: rework, containment, expedited freight, warranty reserves, and the unquantifiable cost of a product recall. Think of unit cost as the visible portion of an engineering blueprint. The control infrastructure beneath it—QC protocols, traceability systems, change management—determines whether that blueprint holds at scale.
A private-label program that survives scale has a blueprint that includes controls to prevent drift, controls to detect drift early, and clear accountability when something goes wrong. When you optimize for the lowest visible cost, you often inherit the highest invisible risk.
How the Lowest Bidder Hits the Number (and Where Risk Hides)
Suppliers don’t manufacture margin from nothing. A quote 10–15% below market signals that something has been removed. Understanding what helps you evaluate whether the trade-off is acceptable.
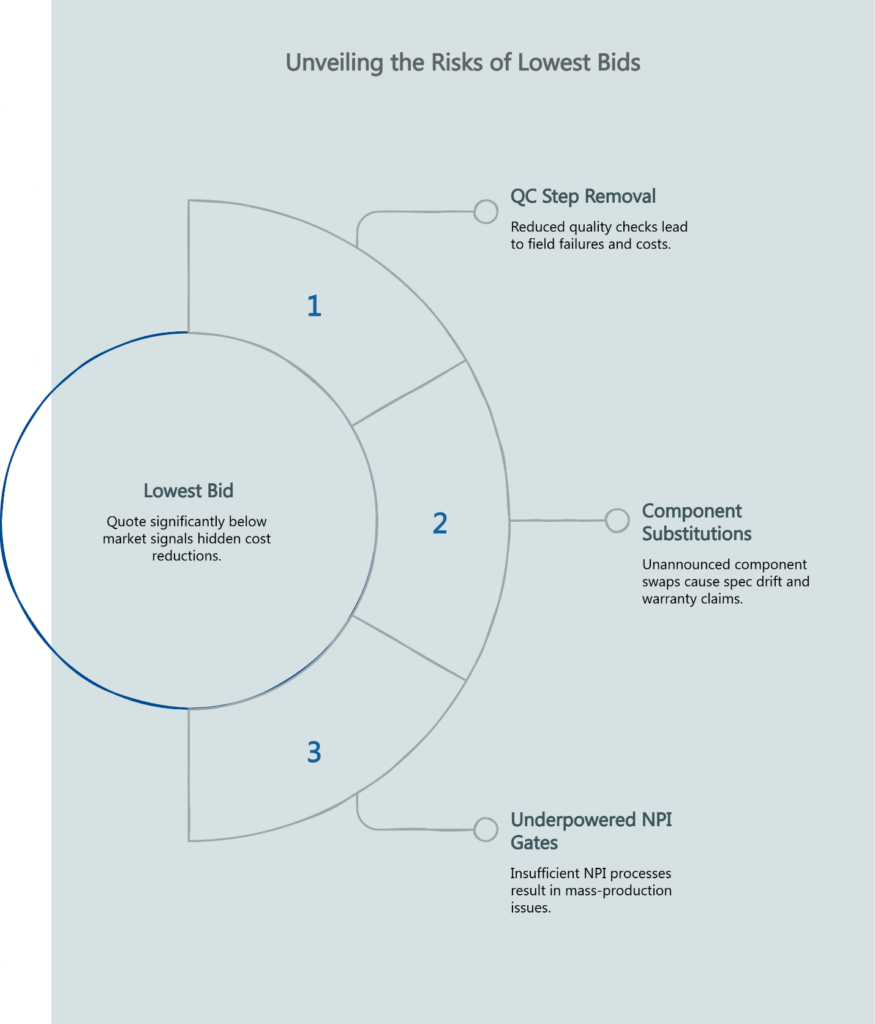
QC Step Removal. Inspection adds labor cost. A low-cost supplier may reduce in-process quality checks (IPQC) or skip final quality control (FQC) sampling rates. The appraisal cost disappears from their quote—and reappears as field failures in yours.
Component Substitutions and Silent Swaps. Capacitors, resistors, and connectors have “equivalent” alternatives at lower price points. Without formal change-control agreements, suppliers may substitute components mid-run without notification. Spec drift happens quietly. You discover it when warranty claims spike.
Underpowered NPI Gates. New Product Introduction requires engineering time: DFM reviews, pilot builds, limit-sample validation. Cutting these prevention costs accelerates the quote but compresses the window to catch design-for-manufacturability issues. A successful prototype does not prove mass-production readiness—one of the most common misconceptions in private-label programs. Problems surface later, as yield instability or field failures, when fixing them costs more.
Hidden Cost #1: Quality Drift After the First Run
A successful prototype does not prove mass-production readiness. The first run often benefits from heightened attention: senior technicians, hand-selected components, extra inspection passes. What matters is Run 5, Run 10, Run 20.
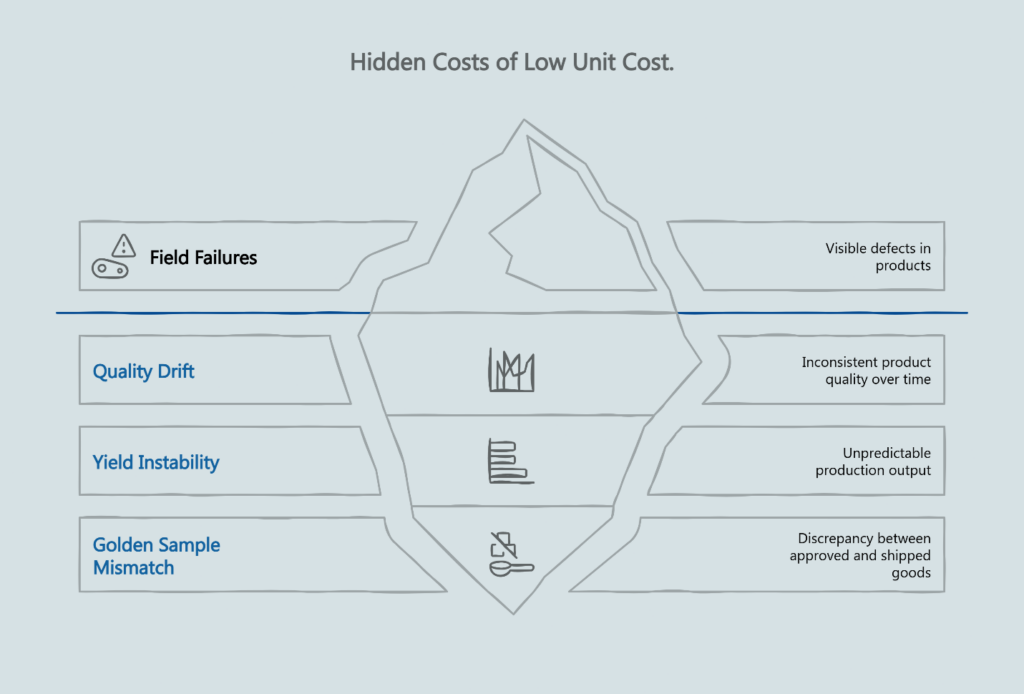
Golden Sample Mismatch at Scale. Quality Drift often shows up as a gap between what you approved and what you’re shipping. The Golden Sample defines the target, but without a Limit Sample to bound acceptable variation, “matching the Golden Sample” becomes subjective. A common human-error pattern is approving a Golden Sample without a Limit Sample, so disagreements become arguments instead of corrective actions. Disputes emerge. Rework cycles lengthen. The original 8-week lead time becomes 12.
Yield Instability and Containment Costs. First-Pass Yield (FPY) measures how many units pass inspection without rework. A supplier with inconsistent FPY forces you into containment mode: sorting, re-testing, or scrapping batches. When process stability is weak, yield doesn’t just decline gradually—it becomes noisy. That noise forces extra inspections, line holds, and engineering time to isolate root causes. Each percentage point of yield loss translates directly to cost per sellable unit.
Field Failures and Brand Trust Erosion. Defects that escape the factory become warranty claims. Warranty claims become negative reviews. Negative reviews erode the brand equity you spent years building. The math is asymmetric: depending on your product’s margin structure and service cost model, an estimated 2% increase in field-failure rate can frequently erase a 10% BOM saving when you factor in replacement cost, customer service burden, and customer acquisition loss.
Hidden Cost #2: Traceability Gaps = No Accountability
When a defect surfaces, the first question is: Where did it come from? Without traceability, the answer is a shrug.
Black Box vs. Glass Box Manufacturing. A “Black Box” supplier delivers finished goods with no visibility into production history. A “Glass Box” supplier provides unit-level or lot-level traceability: which components went into which units, which test data corresponds to which serial numbers, which operator handled which station. If you can’t see what happened, you can’t manage it. A black-box supplier asks you to trust outcomes; a glass-box supplier shows evidence.
Traceability is your manufacturing firewall. It contains problems to specific batches instead of entire production runs. It enables root-cause analysis. It proves accountability when disputes arise.
What Traceability Evidence to Demand. At minimum, require barcode or QR-code binding of test data to individual units. Ask for lot-level component traceability. Verify that the supplier’s ERP/WMS enforces FIFO (first-in-first-out) to prevent component age-out. These aren’t premium features—they’re baseline governance. Industry standards for manufacturing data traceability outline why trustworthiness depends on this infrastructure, and the IPC-1782 standard for manufacturing and supply chain traceability provides the critical framework for evidence-based electronic hardware governance.
Hidden Cost #3: Change Control and the “Mixed Build” Nightmare
Components go end-of-life. Suppliers find cost-reduction opportunities. Engineering discovers a design improvement. Change is inevitable. Uncontrolled change is catastrophic.
ECO Cut-In Planning. An Engineering Change Order (ECO) must specify when the change takes effect—at which serial number, which lot, which shipment. Without a cut-in plan, you risk “mixed builds”: units with old components and new components shipping in the same carton. Field service becomes impossible. Warranty claims spike. Root-cause analysis collapses.
Rework and Schedule Slip Mechanics. A poorly managed ECO forces rework on in-progress inventory. Rework consumes labor, delays shipment, and often requires expedited freight to recover the schedule. The nominal cost of the component change multiplies through the supply chain. When change control is weak, you get the classic failure chain: partial rework, partial ship, partial hold—then a late-stage scramble to reconcile what’s in the channel.
Keep this decision-relevant in your RFQ: you’re not buying a procedure manual; you’re buying the governance that prevents “we’re not sure which units are affected.”
Decision Framework: Total Cost of Quality for Private Labels
The Cost of Quality (COQ) model, originally conceptualized by Armand V. Feigenbaum and widely championed by ASQ, divides quality-related spending into four categories: prevention costs (engineering time, DFM reviews, supplier qualification, training), appraisal costs (inspection, testing, audits), internal failure costs (scrap, rework, re-inspection before shipment), and external failure costs (warranty, field service, brand damage).
Low-cost suppliers typically minimize prevention and appraisal. The spending doesn’t disappear—it shifts into internal and external failure categories where costs are nonlinear. Your job is to quantify that shift.
What to Compare Across Bidders. When evaluating two suppliers, don’t stop at BOM price. Ask: What is your historical FPY, and how do you measure it? What traceability level do you provide (unit, lot, component)? How do you manage ECO cut-in? What certifications govern your QMS? The answers reveal whether you’re comparing equivalent control stacks or trading control for cost.
Build the True Cost Calculator
This is the artifact that earns internal consensus—a spreadsheet that translates “higher unit cost” into “lower program risk.”
Inputs to Model
| Field | Supplier A | Supplier B | Notes |
|---|---|---|---|
| Unit price | Quoted EXW/FOB as applicable | ||
| Order quantity (units) | Same volume for comparison | ||
| Expected defect exposure (%) | Your scenario assumption | ||
| Rework cost per affected unit | Labor + downtime proxy | ||
| Containment/retest cost per unit | Sorting, extra inspection | ||
| Expedited freight/schedule recovery (total) | If instability forces recovery | ||
| Audit/engineering time (total) | Supplier onboarding + escalations | ||
| Warranty reserve per shipped unit | Scenario assumption | ||
| Brand-risk note | Qualitative: Low/Med/High |
Outputs and Break-Even Logic
Calculate Effective Cost per Sellable Unit: Unit Price + (Defect Rate × Rework Cost) + (Field Failure Rate × Warranty Reserve) + Amortized Audit Cost.
Then find the break-even defect delta. If the unit-price delta between suppliers is d and the incremental cost per defect event is C, the break-even defect delta ≈ d / C. This tells you at what defect-rate difference the “cheaper” supplier becomes more expensive—before you even count schedule recovery, warranty risk, or brand cost.
How to Use It. Present this calculator in vendor-selection meetings. It reframes the conversation from “Who’s cheapest?” to “Who’s safest at scale?” Use it two ways: as a shortlisting gate (if a supplier can’t evidence traceability and change control, they start at “High risk” regardless of unit price) and as a consensus artifact that lets you walk finance through the break-even math without arguing about engineering judgment.
Minimum Control Stack Worth Paying For
Some controls aren’t optional. They’re stability infrastructure.
ISO 9001 QMS discipline signals that documented processes exist and that someone audits them. A misconception to avoid: ISO certification alone doesn’t guarantee product quality—it guarantees process documentation. What matters is whether that documentation translates into governed, measurable, repeatable execution.
Golden sample management with KLIPPEL QC provides objective, repeatable verification that production units match the approved reference. Barcode and QR traceability binding test data to units ensures every unit’s test results are retrievable by serial number—non-negotiable for root-cause analysis.
Multi-stage inspection (IQC/IPQC/FQC) and reliability testing catch problems at each phase: Incoming Quality Control catches component issues, In-Process QC catches assembly issues, Final QC catches escape defects, and reliability testing (thermal cycling, power stress) catches latent failures before they reach customers.
These capabilities cost more. They cost less than the alternative. For a deeper look at how these controls work in practice, explore amplifier production capabilities and OEM amplifier manufacturing services. If you want a structured evaluation approach, the risk-minimized OEM amplifier supplier selection framework and the rationale behind why supplier fit beats lowest BOM connect naturally to this discussion.
Diagnosing the System: When the Problem Isn’t Price
Sometimes the root cause isn’t a bad supplier—it’s a broken internal process.
Sales Timeline Pressure vs. Quality Timeline. When sales commits to a Q4 launch regardless of production readiness, QA becomes a checkbox rather than a gate. The pressure to “hit the number” overrides the discipline to validate the number. A Golden Sample gets approved without a Limit Sample. Pilot-run feedback gets ignored. The program ships on time—and fails in the field. If your organization is pushing a launch “regardless of readiness,” your sourcing decision is being forced to absorb schedule risk. Call it what it is: a risk transfer.
False Security of One-Time Audits. A factory tour is not due diligence. A single audit is a snapshot, not a trend. What matters is ongoing process evidence: statistical process control charts, yield trend reports, corrective-action logs. A factory tour can validate that a capability exists; it can’t prove that capability is governed, measured, and repeatable. For private label, prefer evidence over showroom tours.
Next Step: De-risk Your Next Private-Label Amplifier Program
Selecting an OEM amplifier manufacturing partner isn’t about finding the lowest quote. It’s about finding the control infrastructure that protects your margin and your brand.
If you’re evaluating suppliers for a private-label amplifier program, get in touch. We’ll walk through your RFQ requirements, explain how our amplifier production capabilities address Quality Drift risk, and show you the traceability and change-control systems behind the unit price.
The lowest unit cost looks rational on a spreadsheet. Until it doesn’t.
Disclaimer: This content is for informational purposes and should not replace professional manufacturing or quality assurance advice specific to your program requirements.
Our Editorial Process:
Our expert team uses AI tools to help organize and structure our initial drafts. Every piece is then extensively rewritten, fact-checked, and enriched with first-hand insights and experiences by expert humans on our Insights Team to ensure accuracy and clarity.
About the China Future Sound Insights Team
The China Future Sound Insights Team is our dedicated engine for synthesizing complex topics into clear, helpful guides. While our content is thoroughly reviewed for clarity and accuracy, it is for informational purposes and should not replace professional advice.