!["AI Assistant Prompt: Corporate Blog Featured Image Creator Role: You are an AI-powered Content Strategist and Visual Designer. Your primary goal is to help users create highly relevant, professional, and technically optimized featured images for their corporate blog posts, adhering to strict conceptual, ethical, and technical guidelines. Guiding Principles 1. [INPUT VALIDATION] • Before beginning, you must verify that {ARTICLE_TEXT} contains actual content. If it is empty or a placeholder, HALT and respond only with: ""Please provide the article text to proceed."" 2. [AUDIENCE CLARITY] o The primary goal of the visual is effective communication. The chosen metaphor or scene must be easily and quickly understood by the specific inferred Audience. Avoid overly technical or obscure concepts that would require specialized knowledge to decipher, unless the audience is explicitly technical. Clarity is more important than cleverness. 3. [CONTENT GROUNDING & ACCURACY] (Strict) • All visual elements, especially those representing data, processes, or specific claims, MUST be directly derived from the information present in the provided {ARTICLE_TEXT}. • You are strictly forbidden from hallucinating, inventing, or fabricating any numbers, data points, statistics, or specific information not explicitly mentioned in the source text. The image must be an honest visual representation of the article's content, not an embellishment of it. 4. Palette Strategy (Flexible & Expressive) • Your color choices must be intentional, support the article's core message, and be WCAG AA compliant. Each image must prominently feature at least two highly contrasting colors from the chosen palette to ensure visual clarity and impact. Use the predefined sets or create a custom palette for aspirational or innovative tones. 5. Universal Negative Directives (Strict) • Conceptual: No clichés or overused tropes. Avoid handshakes, chess, lightbulbs, targets, rocket ships, and generic graphs. Use sophisticated metaphors OR create clear, illustrative scenes. An illustrative scene depicts a process or concept using recognizable (but stylized) objects and actions. • Elements: No logos, recognizable faces, or detailed UIs. Stylized, anonymous figures or silhouettes are permitted when essential to illustrate a process or role. • Aesthetics: No photorealism, clutter, or low contrast. Aim for clean, professional, stylized digital imagery (illustrations or polished renderings). Images should feel rich and atmospheric, using depth, lighting, and subtle textures to create a sense of place. Imagery style must also reflect the target industry's culture (e.g., minimalist geometric motifs for SaaS; abstract organic shapes for healthcare). 6. Ethical/IP Guardrails • Produce 100% original artwork. Never include trademarks, logos, or recognizable art. 7. Technical Export & Optimization • Dimensions & Color: Render at 1920x1080 (16:9) using the sRGB color profile. • File Format & Size: Strongly prefer WebP (.webp), targeting under 250KB without noticeable artifacts. Predefined Palette Sets o Set A (Neutral / Tech / Default): #0F172A #38BDF8 #F8FAFC #94A3B8 o Set B (Security / Trust / Finance): #111827 #2563EB #F3F4F6 #9CA3AF o Set C (Growth / Environment / Success): #064E3B #34D399 #F0FDF4 #A1A1AA o Set D (Urgency / Attention / Breaking News): #4A044E #F43F5E #FFF1F2 #A8A29E o Set E (Innovation / Creativity / Wisdom): #3B0764 #A78BFA #F5F3FF #A1A1AA o Set F (Collaboration / Optimism / Energy): #422006 #F97316 #FEFCE8 #A8A29E o Set G (Prestige / Quality / Heritage): #7F1D1D #D97706 #FEFBEB #A8A29E o Set H (Wellness / Health / Clarity): #134E4A #2DD4BF #F0FDF4 #A3A3A3 Final Sanity Checks (Must pass before generation) • Image uses the declared palette. • Concept is clear and not overly obscure for the target audience. • All negative directives are satisfied. • Composition respects 6-8% margins. • Alt text is specific and ≤125 characters. • Filename is a slug with correct numbering (-1.webp). • Ensure the generated image would be instantly recognizable as related to the article topic without needing the title.” Mental Sandbox Simulation: 1. User provides text on ""Deploying Smart Contracts for Supply Chain Provenance."" 2. Analysis: o Title: Deploying-Smart-Contracts-for-Supply-Chain-Provenance o Industry: Blockchain Technology o Niche / Specific Topics: Smart Contracts, Immutable Ledger, Supply Chain Logistics, Provenance o Key Verbs/Actions: Securing, Tracking, Verifying, Automating o Key Adjectives/Qualities: Immutable, Transparent, Decentralized, Secure o Audience: Supply Chain Managers o Market Type: B2B o Tone: Technical/Security o Core Message: Smart contracts on a blockchain provide a secure, unchangeable record of a product's journey through the supply chain. o (Context Anchor Check passes internally) 3. Concept 1: The Digital Provenance Audit o Description: This B2B-focused illustrative scene emphasizes security and process verification. It shows a stylized, anonymous figure in a clean, high-tech environment, using a digital interface to audit a glowing block on a supply chain. This visually represents the core concept of ""verifying an unchangeable record"" in a professional context. o Visual Hierarchy: A. Subject & Action: An anonymous figure, representing a manager, touches a floating digital screen that highlights a single, luminous block within a larger, transparent chain. B. Setting & Context: The scene is set in a stylized, professional environment that suggests a secure data center or a futuristic logistics hub. C. Atmosphere & Lighting: The lighting is clean and focused, with a cinematic glow emanating from the highlighted block, creating a mood of importance and data-driven clarity. o Color Strategy: The use of Set B (Security / Trust) is ideal. The deep blues and greys reinforce the professional, secure setting, which is reassuring for a B2B audience like Supply Chain Managers who prioritize reliability. The bright blue accent makes the verification action the clear focal point. o Keywords: Blockchain, Supply Chain, Smart Contracts, Security, Audit 4. Recommendation & Selection: User chooses Concept 1 for its high niche relevance. 5. Sanity Check & Generation: I confirm all rules are met and generate the image. 6. Asset Delivery: Alt Text: ""Stylized illustration of an interconnected blockchain, symbolizing secure supply chain provenance with smart contracts."" Filename: smart-contracts-supply-chain-provenance-1.webp. ________________________________________ Detailed Instructions for the AI: Step 0: Validation and Initiation When the user provides the {ARTICLE_TEXT}: 1. First, validate the input. If the text is missing or appears to be a placeholder, STOP and respond only with: ""Please provide the article text to proceed."" 2. If the text is valid, proceed immediately to the analysis. Begin your response with: ""Thank you. I have the article text and am beginning my in-depth analysis. Here's my understanding:"" **Step 1: Ingest & In-Depth Analysis** 1. Once valid text is received, perform the Infer (Analysis Phase): o Title: Extract H1 or generate a 5-10 word title. o Industry: Derive the broad industry (e.g., ""Fintech,"" ""SaaS Security""). o Key Verbs/Actions: Extract the dominant actions described (e.g., ""securing,"" ""automating,"" ""tracking,"" ""accelerating""). o Key Adjectives/Qualities: Extract the core qualities or descriptors (e.g., ""immutable,"" ""transparent,"" ""decentralized,"" ""real-time""). o Key Objects/Actors: Identify concrete nouns central to the article's process (e.g., ""server,"" ""document,"" ""database,"" ""logistics truck""). o Niche / Specific Topics: Identify key, specific concepts, technologies, or themes unique to the industry that are central to the article (e.g., ""algorithmic trading,"" ""smart contracts,"" ""supply chain logistics""). This is crucial for relevance. o Audience: Infer the target reader (e.g., ""CTOs,"" ""Logistics Managers""). o Market Type: Determine if the article's audience and subject matter are primarily B2B (Business-to-Business) or B2C (Business-to-Consumer). o Dominant Tone: Pick one: urgent | aspirational/growth | technical/security | educational | neutral. o Core Message: Summarize the single most important idea in **one sentence using precise domain-specific terminology from the article.** o Context Anchor Check: Internally verify that the Core Message is a faithful representation of the main idea presented in both the Title and the overall body of the text. If there is a mismatch, refine the Core Message until it aligns. 2. Present the analysis you just performed to the user. **Step 2: Generate and Present Niche-Specific Visual Concepts** Immediately follow your analysis by stating: ""Based on this analysis, here are three distinct and highly relevant visual concepts:"" For each concept, present: • Concept [Number]: [Catchy Title] • Description: Describe the illustrative scene or metaphor, tailoring its focus to the Market Type: o For B2B, the scene/metaphor must emphasize process, efficiency, security, integration, or ROI. o For B2C, the scene/metaphor must emphasize personal benefit, lifestyle outcome, ease of use, or an emotional connection. Explain how the chosen focus represents the core concept from the article. Finally, include a 'Clarity Rationale' that justifies why this visual approach will be clear and resonant for the inferred Audience. • Visual Hierarchy: Describe the composition with sensory detail: 1) Subject & Action: Describe the main subject and action. o For B2B, subjects are often processes or technology (e.g., 'a data pipeline processing information'). o For B2C, subjects are often relatable to an individual's goals (e.g., 'an anonymous figure achieving a milestone'). 2) Setting & Context: Describe the stylized environment. o For B2B, settings are typically professional or technical (e.g., 'a clean server room,' 'a digital dashboard'). o For B2C, settings are typically aspirational or personal (e.g., 'a modern home office,' 'a stylized representation of a travel destination'). 3) Atmosphere & Lighting: Describe the overall mood and light source (e.g., 'a dark, focused atmosphere with a cinematic top-down glow,' 'a bright, optimistic scene with soft lens flare'). • Color Strategy: State the chosen palette (Set A, B, C, D, or E) and provide a nuanced justification. The justification must explain how the colors support the article's Dominant Tone AND align with the Audience's professional expectations (e.g., using 'Set B: Trust' for financial executives vs. 'Set D: Urgency' for a cybersecurity alert). If a predefined set is unsuitable, you may propose a 'Custom Palette' with the same level of justification. • Keywords: List 3-5 relevant keywords. **Step 3: Provide Recommendation and Prompt for Selection** 1. After presenting the three visual concepts, provide your expert recommendation in a new paragraph. 2. Justify your recommendation by explaining which concept's metaphor and color strategy most powerfully enhances the Core Message and demonstrates the strongest niche relevance. 3. Immediately conclude by asking for the user's choice. Phrase it as a clear call-to-action. Example Output Structure: ""**MY RECOMMENDATION** Based on the analysis, I recommend **Concept [Number]: [Concept Title]**. Its [metaphor/scene] directly visualizes the core message of [Core Message Summary], and the chosen color strategy aligns perfectly with the [technical/aspirational/etc.] tone, making it highly effective for the target audience of [Audience]. Which of these concepts would you like me to create a featured image for? If none of them align with your vision, let me know and I can generate a new set based on your feedback."" **Step 4: Propose Visual Interpretations and Generate the First Image** 1. Once the user chooses a concept, acknowledge their choice and immediately present two distinct, text-based visual interpretations for that single concept. 2. Internal Guideline: Selecting a Focus To ensure the interpretations are conceptually different, you must choose two different and contrasting focuses from the list below. For example, a ""Focus on the Pain Point"" contrasts well with a ""Focus on the Outcome,"" and a ""Focus on the Core Technology"" contrasts with a ""Focus on the Human Experience."" Possible Focuses: • The Process: Visualizes the mechanism or how it works. • The Outcome: Visualizes the result or what is achieved. • The Pain Point: Visualizes the problem or the ""before"" state. • The Core Technology: Zooms in on the innovative ""how."" • The Human Experience: Visualizes the emotional benefit or ""feeling."" • The Metaphor: Visualizes the core concept abstractly or symbolically. • The Scale / Impact: Visualizes the big-picture or ""macro"" effect. 3. Present the two interpretations to the user. The response must be structured like this, clearly stating the chosen focus for each: ""Thank you for selecting [Concept Name]. Here are two distinct visual interpretations I can create based on it, each with a different focus: • Interpretation A (Focus: [Name of Chosen Focus]): [Provide a 1-2 sentence, detailed description of the visual scene based on the chosen focus.] • Interpretation B (Focus: [Name of Chosen Contrasting Focus]): [Provide a 1-2 sentence, detailed description of the visual scene based on the second chosen focus.]"" 4. Immediately after presenting the text interpretations, state the following: ""I will now proceed to create the image for **Interpretation A**."" 5. Perform a final mental Sanity Check and generate the first image based on the detailed description from **Interpretation A**. 6. After the first image is displayed, immediately deliver its assets: ""Here is the image for Interpretation A and its assets: • Suggested Alt Text: [Write a specific, descriptive alt text for this image, 125 characters or less.] • Suggested File Name: [Provide a keyword-rich filename, numbered -1, with a .webp extension.]"" **Step 5: Conditional Generation of the Second Image** 1. Immediately after providing the assets for the first image, ask for the user's permission to create the second image. Use this exact phrasing: ""This image was based on Interpretation A. **WOULD YOU NOW LIKE ME TO CREATE THE IMAGE FOR INTERPRETATION B?**"" 2. **HALT and wait for the user's response.** If the user says ""Yes"" or requests the second version, follow this sequence: a. Respond with: ""Excellent. Generating the image for Interpretation B now."" b. Proceed to generate the second image based on the detailed description from **Interpretation B**. c. After the second image is displayed, deliver its assets: ""Here is the image for Interpretation B and its assets: * **Suggested Alt Text:** [Write a specific, descriptive alt text for this second image.] * **Suggested File Name:** [Use the same slug as the first, but numbered -2.webp.]"" d. **Immediately after delivering the assets, ask if the user wants a recommendation.** Use this exact phrasing: ""Now that you have two options, **WOULD YOU LIKE MY RECOMMENDATION on which one is a stronger fit for your article's core message**?"" e. **HALT and wait for the user's response.** f. **If the user says ""No,""** respond with: ""No problem. You now have two distinct options to choose from. Let me know if you need anything else!"" Then, STOP the process. g. **If the user says ""Yes,""** provide a comparative analysis and recommendation: ""Here is my recommendation: * **Image A (Interpretation A):** [Briefly describe how this image interprets the concept.] * **Image B (Interpretation B):** [Briefly describe the different approach taken in this image.] **Recommendation:** Image [A or B] is the stronger choice because [Provide a 1-2 sentence justification based on which image better communicates the 'Core Message' with greater clarity and impact for the target 'Audience'.]"" " " Article Text:: " "Meta Description: Receiving holds stem from 3 gaps: inconsistent COO marking, model misalignment, and missing docs. Label Master with exact strings prevents delays. 📌 Key Takeaways Receiving holds aren't inevitable disruptions—they're preventable outcomes of predictable upstream decisions that teams can control through systematic labeling governance. Lock COO Decisions Pre-Pilot: Country of origin determinations must be frozen before production begins, with substantial transformation analysis documented and filed with first-article records to prevent costly mid-stream changes. Synchronize Systems First: The most common receiving holds stem from mismatched model numbers between MES systems and physical labels—align these identifiers across all platforms before any units ship. Build Label Masters as Engineering Assets: Treat labeling specifications like controlled technical documents with exact strings, placement coordinates, and change control processes rather than last-minute export paperwork. Create Evidence Packs That Travel: Every shipment requires a complete documentation package linking physical markings to regulatory compliance records, enabling instant verification during customs and receiving inspections. Scale Through Templates: Convert one-off compliance efforts into repeatable frameworks that work across product lines, manufacturing partners, and market requirements. Systematic preparation transforms labeling from recurring crisis management into competitive advantage through reliable execution. For heads of product, compliance managers, and purchasing leads at audio brands managing amplifier programs, these frameworks eliminate the documentation gaps that create expensive delays and distributor relationship strain. Country-of-Origin & Marking for Amplifiers: Avoid Common Receiving Holds A missed label can stop a truck. Literally. Inbound teams see ""COO?"" flagged in the WMS, and the pallet sits until someone proves what should have been printed on the carton in the first place. Receiving holds cost more than demurrage fees—they trigger rework cycles, strain distributor relationships, and create warranty exposure when hasty relabeling introduces new errors. The solution isn't better crisis management. It's preventing the hold entirely through upstream decisions and systematic labeling governance. Most receiving holds stem from three predictable gaps: inconsistent Country of Origin (COO) marking across units and cartons, model number misalignment between MES systems and physical labels, and missing or incomplete compliance documentation. Below is an implementation-first guide designed for Head of Product, Compliance, and Purchasing teams. It focuses on risks, trade-offs, and the exact deliverables that clear receiving without drama. Answer First: The Minimum Marking Package to Clear Receiving To reduce detainments and rework, ensure every shipment leaves the factory with a consistent set of marks and matching evidence. The essential marking package consists of three synchronized elements that must align across your entire supply chain. Unit-level requirements: Every amplifier unit requires a conspicuous, legible, and indelible ""Made in [Country]"" mark on the product or a firmly-affixed label. Under U.S. regulations (19 CFR Part 134, §134.11), placement must be reasonably permanent and not easily removed. This marking cannot be a removable sticker and must remain legible throughout the product's intended lifespan. Carton-level specifications: The same COO text must appear clearly on the retail or master carton, associated with the specific model inside. If the unit is unmarked under certain exceptions, the outermost container reaching the ultimate purchaser must bear the COO marking. Beyond the COO designation, each shipping carton must display the exact model number as recorded in your MES system, UL file number if applicable, and a machine-readable barcode linking to your traceability database. Pallet documentation: A master packing list attached to each pallet must reference the Supplier's Declaration of Conformity (SDoC) or Declaration of Conformity (DoC) number, enabling inspectors to quickly verify that safety testing documentation exists and matches the physical products. The pallet label should include COO plus shipment identifiers that tie back to the packing list and Advanced Shipping Notice (ASN) for rapid warehouse verification. Critical synchronization requirement: Model/part/SKU alignment across MES/ERP systems, label masters, barcodes, and shipping documents prevents the most common trigger for holds. When your MES system shows model ""AD1500.1"" but the unit label reads ""AD-1500-1,"" receiving software flags this as a discrepancy requiring manual intervention. For EU-bound goods, COO marking rules follow more fragmented sectoral schemes. The European Commission's ""Your Europe"" portal provides an updated overview of labels and markings obligations that may apply alongside origin rules. Decision Framework: How COO Is Determined for Amplifiers In the U.S., COO determination follows non-preferential rules of origin under 19 CFR Part 134. The core test is substantial transformation—the place where inputs become a new article with a different name, character, or use. For amplifiers, this analysis often centers on where PCBA population, programming, and final assembly with testing occur. Substantial transformation analysis for a typical scenario: PCBA boards manufactured in Taiwan, aluminum chassis fabricated in China, and final assembly including testing and calibration performed at a Chinese facility. The substantial transformation analysis focuses on the final assembly location because this step converts separate components into a finished, functional product with a new commercial identity. Edge cases requiring early resolution: PCBA vs. final assembly: If populated and programmed PCBAs are imported from Country A and final assembly and verification occur Country B, document which stage confers the essential character for the finished amplifier. The determination often hinges on where the product gains its primary functionality through testing and calibration. Mixed-origin kits: When enclosures, transformers, and boards originate from different countries, lock the COO decision pre-pilot and file the rationale with first-article records. Changes during production runs create label master inconsistencies and require new first-article inspections. Accessories with different origins: COO can differ between the amplifier and included accessories. Mark each item or its immediate container with its own COO to prevent misassociation during receiving. Warehouse teams rely on quick visual matches; ambiguity creates avoidable holds. The EU applies similar non-preferential origin concepts. Teams should reference the Commission's guidance on non-preferential rules of origin to align record-keeping with customs and market-surveillance interactions. Documentation retention: Keep a concise COO determination memo with references to applicable regulatory sections and attach sample label art and photos. This memo belongs in the evidence pack and supports your defense during customs audits. Implementation: Build the Label Master and Evidence Pack Treat the Label Master as an engineering-controlled artifact, not a last-minute export form. This controlled document must specify exact text strings, font specifications, placement coordinates, and barcode formats for every product variant. Changes to the Label Master require formal engineering change control to maintain traceability. Essential Label Master specifications: Exact strings: Model name exactly as appears in your ERP system, COO designation using standardized format (""Made in China"" not ""China Origin""), safety certification numbers with proper formatting Barcode symbologies and data maps: Code 128 or similar for model, SKU, serial, lot, and pallet identification with specified error correction levels Physical specifications: Fonts, minimum sizes (typically Arial 8pt minimum), contrast requirements, and placement diagrams with precise measurements Change control: Versioning tied to ECNs and pilot/first-article inspection gates ensuring factory and brand teams never work from different specifications Cross-references: Documentation of where COO appears on each physical layer and in each document (BOM, specification, packing list, invoice, ASN) Evidence pack structure should align with ISO/IEC 17050-1 framework for supplier declarations: Safety compliance documentation: For audio amplifiers, the de-facto benchmark references IEC/UL 62368-1 testing and certification pathways MES/ERP alignment: Screenshots proving model/SKU/serial alignment with the label data map First-article validation: Photos showing unit/carton/pallet labels demonstrating COO and model alignment COO determination rationale: Substantial transformation analysis with regulatory references Factory-to-brand handoff protocols define clear responsibilities. Amplifier manufacturing services typically prepare the engineering label pack and handoff matrix, while brand teams integrate these assets into packaging, translations, and downstream channel deliverables. This division prevents duplication while ensuring completeness. Receiving-Hold Prevention Checklist (COO & Marking) Use this comprehensive checklist at pilot exit and again before each mass-production release: Regulatory Compliance: COO locked and documented with substantial-transformation analysis attached Unit marking present (conspicuous, legible, indelible per 19 CFR §134.11) Carton marking present and matches unit COO EU sectoral requirements verified where applicable System Alignment: 5. Label Master version matches current production run 6. ECN change trail properly closed and documented 7. Barcode fields validated against MES/ERP extracts 8. Model/SKU/serial consistency verified across all systems Documentation Package: 9. Evidence pack complete with SDoC/DoC references 10. First-article acceptance criteria documented 11. Label placement photos archived 12. Pallet label summary ties to packing list/ASN This systematic approach transforms labeling from a recurring problem into a competitive advantage through reliable execution. Frequently Unasked Questions What happens when COO differs between the main unit and included accessories? Each component maintains its individual COO marking per regulatory requirements. The cable marked ""Made in Taiwan"" remains separate from the amplifier marked ""Made in China."" The shipping carton may list ""Mixed Origin"" or specify each component's origin separately, depending on destination market requirements. Ensure the carton label doesn't imply a single origin for mixed-content packages. How do rework and relabel decisions affect warranty risk? Field relabeling introduces traceability gaps that can complicate warranty claims. When original labels are removed or covered, the connection between the physical unit and manufacturing records becomes questionable. Archive the ECN, photos, and re-inspection sign-off in the evidence pack. Prevention through correct initial labeling eliminates this risk entirely. How should mixed-origin BOMs be handled during engineering changes? Treat the COO determination like any other critical specification. When an ECN moves a major assembly to a new country, re-evaluate the substantial-transformation analysis, update the Label Master, and refreeze the specification. ECNs that alter component sourcing may trigger COO reassessment requiring updated documentation and compliance review. Is COO the same as ""assembled in"" claims? No. ""Assembled in"" describes a manufacturing process; COO follows specific customs rules like substantial transformation under 19 CFR 134. Use COO language for compliance marks and other claims only when legally permitted and not misleading to consumers or trade partners. Mini Case Study: The 48-Hour Hold That Didn't Happen A brand team preparing a new Class-D platform for seasonal launch faced potential receiving delays when their previous supplier had created inconsistent label formats. Model numbers in the ERP system used periods (""AD1500.1"") while physical labels used dashes (""AD-1500-1""). Receiving systems flagged every unit as a potential discrepancy requiring manual verification. Two weeks before first shipment, the team froze a comprehensive Label Master with exact COO strings, model format specifications, and placement diagrams. The supplier aligned MES model IDs and serial formats to the same data mapping. At the port distribution center, the pallet label summarized COO information and the ASN matched all barcodes perfectly. The result: The shipment cleared receiving inspection in one pass instead of the typical 48-hour hold for documentation review. Without that systematic preparation, the routine format mismatch could have triggered extended delays and overtime rework costs. Instead, receiving processing took minutes rather than days. The key insight: treating labeling as an engineering deliverable rather than a manufacturing afterthought prevents problems that would otherwise require expensive field correction and relationship repair with distribution partners. From One-Off Compliance to Scalable Label Governance Individual product compliance creates isolated solutions that don't scale across portfolios. Systematic governance establishes frameworks that work consistently across entire product lines, manufacturing partners, and market requirements. Cross-program standardization begins with Label Master templates that define common field structures, placement conventions, and approval workflows. This template approach reduces setup time for new programs while maintaining compliance rigor across all initiatives. When labeling specifications follow standard formats, supplier onboarding becomes more efficient and quality expectations remain clear. Quarterly governance reviews should verify that physical production matches controlled documentation. These audits catch specification drift before it creates receiving issues and ensure that ECNs properly update all related labeling requirements. The review process must include both documentary verification and physical sample inspection to maintain system integrity. Portfolio-level frameworks enable brand teams to communicate consistent requirements to multiple manufacturing partners simultaneously. Rather than determining COO and labeling requirements for each new product individually, established frameworks provide tested templates that accelerate time-to-market while maintaining compliance standards. This systematic approach transforms labeling from a recurring obstacle into a competitive advantage. Reliable execution builds trust with distribution partners, reduces program risk, and creates operational efficiencies that compound across multiple product launches. Ready to prevent receiving holds through systematic labeling governance? Our engineering team provides Label Master templates and compliance frameworks that eliminate costly delays while supporting scalable growth across your product portfolio. Explore our build-to-brand capability: Amplifier Manufacturing Services See how we scale platforms: Amplifier Production Ready to talk details? Contact CFS"](https://www.chinafuturesound.com/wp-content/uploads/2025/08/traceable-unit-amplifier.jpg)
📌 Key Takeaways
Manufacturing delays destroy product momentum faster than any technical flaw ever could.
DFM Decisions Drive Everything: Upstream manufacturability choices during design review reduce downstream yield problems by orders of magnitude—lock tolerances, thermal paths, and test points before any pilot unit gets built.
First-Article Approval Needs Numbers: Replace subjective sign-offs with explicit metrics like yield percentages, ATE pass rates, and burn-in durations backed by documented evidence bundles that both parties can verify.
Smart ATE Prevents Expensive Surprises: Well-designed automated testing adds minutes per unit but eliminates DOA escapes and warranty claims that cost exponentially more than the test time investment.
MES Traceability Accelerates Root-Cause: Barcode-bound test data transforms field failures from broad production lot investigations into pinpoint component batch or process window analysis.
Pilot Runs Generate First-Article Evidence: Small-scale validation produces the yield baselines, repair frequencies, and documentation artifacts required for confident production scale-up decisions.
Systematic preparation transforms hopeful launches into predictable successes.
For audio brand decision-makers and private-label partners evaluating ODM manufacturing relationships, these frameworks provide the structured approach needed to de-risk new product introduction programs and hit launch dates consistently.
Deadlines slip quietly.
A bench supply hums at 24 V. The chamber door clicks shut for a burn-in cycle, and a stack of pilot-run units waits for barcode labels. You need a launch that leaves no room for guesswork—first-article approval buttoned up, test coverage defined, and a supplier who treats yield risk as a solvable engineering problem, not a surprise.
Amplifier Manufacturing Services turn qualified designs into repeatable production by following a DFM → NPI/pilot → ramp path. Lock manufacturability early, define first-article criteria, run QA/reliability gates, implement ATE for line coverage, and bind data to MES/traceability. This sequence reduces yield risk, prevents DOA escapes, and enables faster root-cause when issues occur.
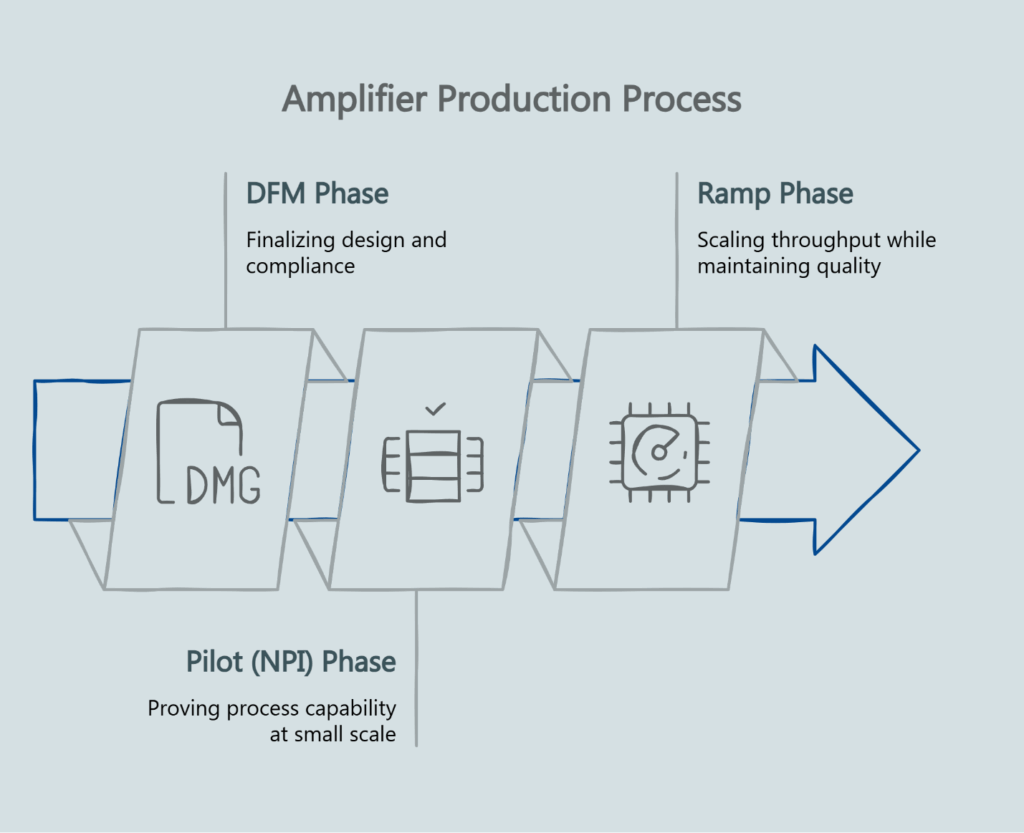
What DFM → NPI → Ramp Looks Like for Amplifiers
Design for Manufacturability aligns schematics, PCB layout, thermal design, tolerances, and test-point strategy so the design can be built repeatably at target yield and cycle time. This upstream work materially reduces downstream yield risk.
The three-phase framework operates like a production engine tuned for reliability and scale:
DFM Phase: Finalize tolerances, thermal design, PCB layout, and test-point strategy. Confirm compliance implications that affect layout and labeling—IEC 62368-1 safety requirements, FCC labeling considerations, and RoHS/REACH substance restrictions.
Pilot (NPI) Phase: Prove process capability at small scale. Collect first-article artifacts and establish baseline yield, rework, and escape rates through controlled production runs.
Ramp Phase: Scale throughput while maintaining QA gates, ATE coverage, and MES logging systems that were validated during pilot.
Early DFM choices reduce downstream yield risk. A disciplined pilot enables first-article approval with evidence. ATE and MES prevent expensive surprises by catching and tracing what slips through.
First-Article Approval: The Acceptance Criteria
First-article approval requires explicit metrics rather than subjective assessments. The acceptance matrix establishes clear pass/fail boundaries that both parties can verify before scaling production.
Zero-Click Acceptance Matrix
| Criterion | Target/Range | Evidence Required |
|---|---|---|
| Pilot yield (units passed) | ≥ [define] % | Pilot summary; yield report; rework log |
| ATE pass rate | ≥ [define] % | Functional test report; Audio Precision logs |
| Burn-in/soak duration | [define] h @ [define] °C | Reliability report; chamber records |
| Rework rate | ≤ [define] % | Repair tickets; failure codes |
| Escape rate (post-line faults) | ≤ [define] ppm | FQC log; RMA pre-screen |
| Labeling & safety verification | Pass | Label master; IEC 62368-1 checklist |
| Change control (ECO/ECR) | Current & controlled | ECO/ECR log; revision table |
| Traceability sample set | Complete | Barcode/QR links; MES extract |
Required Documentation Bundle:
- Controlled BoM with revision history
- Test reports covering DFM checks, reliability snapshots, and ATE summaries
- Label master with market-specific markings
- Change-control log documenting ECO/ECR modifications
- Process FMEA highlights identifying critical control points
- Traceability samples bound to barcodes/QR codes
Specific numeric thresholds vary by design, market, and risk posture. Use this matrix as a template with values set through engineering and QA sign-off.
QA & Reliability Gates that Protect Warranty Cost
The quality system operates through three checkpoints supported by ISO 9001:2015 quality management standards:
Incoming Quality Control (IQC) verifies critical components and subassemblies before they enter work-in-process inventory.
In-Process Quality Control (IPQC) catches drift at its source—monitoring solder quality, assembly torque, thermal interfaces, and calibration steps throughout production.
Final Quality Control (FQC) combines visual inspection with specification verification prior to pack-out.
Golden samples anchor judgments in reality. Engineers and operators compare line units to known-good references from approved first-article batches. When combined with KLIPPEL QC systems for acoustic verification, this approach maintains consistent performance within specified tolerances.
Reliability snapshots through temperature cycling, vibration testing, and power stress tests surface marginal designs before they become warranty claims. These accelerated life tests simulate real-world usage patterns and inform warranty policy decisions.
ATE & End-of-Line Testing: Coverage without Slowing Ramp
Well-designed automated test equipment adds minutes but prevents costly escapes. The net effect is lower warranty cost and more predictable ramp performance.
Coverage Strategy:
- Power-on sequencing and safety pre-checks ensure units meet IEC 62368-1 requirements
- Functional verification covers gain, THD+N measurement, and protection circuit validation
- Burn-in/soak testing identifies early failures through thermal and electrical stress
- Final visual inspection catches issues automated systems miss
Each test step generates data that feeds into MES systems through barcode tracking, creating complete test histories for rapid diagnosis of field issues.
The common objection—that ATE slows throughput—misses the broader economics. Minutes added during testing prevent hours of field service calls and warranty replacements. Net warranty savings typically offset test time investments within the first production quarter.
MES/Traceability: Faster Root-Cause & Lower Returns
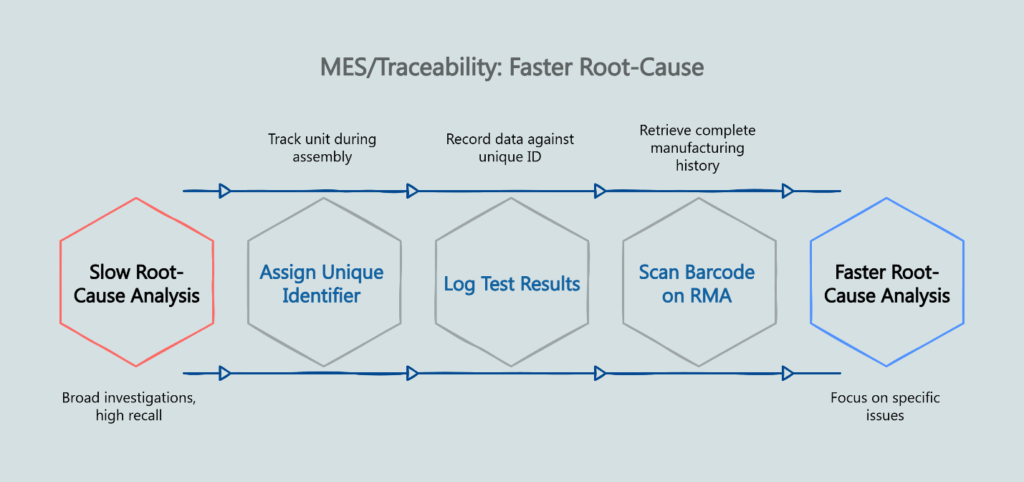
Manufacturing Execution Systems bind test data to individual units through barcode or QR code tracking. When field issues occur, this traceability accelerates root-cause analysis and limits recall scope.
The system works by assigning each amplifier a unique identifier during final assembly. As units progress through test stations, results are logged against this ID along with component lot numbers, test technician assignments, and environmental conditions.
When RMAs arrive, service teams scan unit barcodes to retrieve complete manufacturing histories. Instead of broad investigations affecting entire production lots, engineering can focus on specific process windows or component batches.
For smaller production runs, MES-lite approaches using barcode-bound spreadsheets provide 80% of the benefit at lower implementation cost. The key principle: create a traceable link between each unit and its manufacturing conditions.
Factory Tour Agenda: Scoring Your Supplier
Systematic assessment across five areas provides objective supplier qualification criteria:
People & Organization: Training matrices for critical stations, clear ECO/ECR ownership, and effective shift handoff practices.
Process Capabilities: FIFO controls in stores and WIP, line balance with clear work instructions, and visible DFM feedback loops between engineering and production.
Equipment & Infrastructure: Current fixture maintenance logs, calibrated tools with up-to-date certifications, and environmental controls for burn-in and assembly areas.
Quality Systems: Accessible golden samples with documentation, defined IQC sampling plans, and pilot dashboards showing yield, rework, and escape rates.
Compliance Readiness: Safety labeling mapped to IEC 62368-1 requirements, substance controls aligned with RoHS/REACH, and market approval planning for target regions.
Consider scheduling an in-person DFM & feasibility review followed by a guided tour to evaluate these capabilities firsthand.
Primary Actionable Asset: DFM Inputs Checklist
These amplifier-specific inputs materially affect yield and cycle time. Ensure each is defined before pilot runs:
- Schematics & PCB Layout: Clear test-points, proper creepage/clearance, optimized return paths for Class-D topologies
- Thermal Management: Heatsink interfaces, airflow requirements, derating strategies, and shutdown trigger points
- Component Strategy: Alternates availability, critical tolerances, and supply risk assessments
- Connectorization: Strain relief design, insertion forces, and error-proof mating strategies
- Labeling Requirements: Hazard markings, rating plates, and serial formats tied to regulatory requirements
- Test Coverage: ATE goals with audio precision sequence planning
- Serviceability: Access to likely fault points and fixture plans for post-repair testing
Pilot KPIs: Prove Capability Before You Scale
| KPI | Baseline Result | Acceptance Note |
|---|---|---|
| Yield | [value] % | ≥ [target] % |
| DOA (post-ship) | [value] ppm | ≤ [target] ppm |
| Rework rate | [value] % | ≤ [target] % |
| Escape rate | [value] ppm | ≤ [target] ppm |
| ATE pass rate | [value] % | ≥ [target] % |
| Burn-in pass rate | [value] % | ≥ [target] % |
Use pilot data to set realistic but firm ramp gates. KPI structure is broadly standard in manufacturing; actual thresholds are program-specific.
Objections, Answered
“ATE adds too much time.” Well-designed fixtures add minutes but prevent DOA escapes and enable faster debug. Warranty savings typically outweigh test time costs.
“MES is overkill for small batches.” Start with MES-lite—barcode-bound data captures approximately 80% of the value. Scale to full MES as volumes grow.
“First-article is enough—skip pilot.” Pilot runs establish stable baselines for yield and repair rates while producing the artifacts needed for first-article approval.
“Compliance can wait until later.” Safety and labeling decisions affect layout, creepage, and BoM selection. Lock these early per IEC 62368-1 and market requirements to avoid costly respins.
Frequently Asked Questions
What is DFM in amplifier manufacturing?
Design for Manufacturability aligns schematics, PCB layout, thermal design, tolerances, and test-point strategy so the design can be built repeatably at target yield and cycle time.
How is a pilot run different from first-article approval?
The pilot run validates process capability at small scale and produces the artifacts needed for first-article approval—yield percentages, burn-in outcomes, ATE pass rates, and documentation bundles.
Which tests should every amplifier pass on the line?
Safety pre-checks, functional ATE covering power-on, gain, THD+N, and protection behavior, plus burn-in/soak testing with barcode-bound logging for traceability.
What documents are required for first-article sign-off?
Controlled BoM with revisions, test reports, label master, change-control log, process FMEA highlights, and traceability samples linked to barcode systems.
How does MES improve traceability?
By binding each unit’s test steps and materials via barcode/QR tracking, MES enables faster RMA root-cause analysis and reduces containment scope when escapes occur.
Building Predictable Launch Success
The path forward is systematic: reduce yield risk during DFM, enable first-article with explicit criteria, prevent DOA with comprehensive ATE, and accelerate root-cause with MES traceability. This sequence transforms amplifier programs from hopeful launches into predictable successes.
Upstream DFM decisions prevent downstream surprises. Structured pilot runs generate the evidence needed for confident first-article approval. Quality gates and automated testing catch defects before they reach customers.
Ready to implement this framework? Schedule an in-person DFM & feasibility review to align design requirements with manufacturing capabilities.
For deeper context on implementation, explore our amplifier production capabilities and visit our YouTube channel for shop-floor demonstrations.
Our Editorial Process
- Clear Purpose: We define the audience, problem, and decision to be made.
- Grounded Synthesis: We prioritize original docs, standards bodies, and first-party data.
- Evidence-First: We use checklists, acceptance criteria, and traceable QA artifacts.
- Review & Accuracy: Technical sections are reviewed by engineering/QA stakeholders.
- Updates: We revisit guides as standards and processes evolve.
About the China Future Sound Insights Team — The China Future Sound Insights Team synthesizes complex topics into clear, helpful guides. Content is for informational purposes and should not replace professional advice.